

Introduction
Getting started
Welcome to the PlotAPI documentation. It contains all the information you need to get started using PlotAPI.
What is PlotAPI?
PlotAPI is software that enables you to turn your data into engaging, beautiful, and interactive plots.
The power of PlotAPI can be accessed directly through the API if you're a coder, or using our friendly APP if you prefer not to code.
Plots can be saved in many formats:
- Interactive
HTML - Animated video
MP4 - Static image
PNGandSVG - Document
PDF
They can even be uploaded to the Cloud and shared publicly, privately, or within your Team.
Use the API or the APP
PlotAPI is designed to be "Beautiful by Default".
This means a head-turning visualization is only a single click or single line of code away.
Single line of code with the API
Access the power of PlotAPI directly from your code with the API.
Simply load your data in your source file or notebook, and pass it into one of the plot types.
Let's demonstrate this with the Chord plot type.
Chord(matrix, names).show()
Single click with the APP
Prefer not to code? Access the power of PlotAPI with the App - no coding required.
Simply enter your data using the user-friendly interface and click save.
Let's demonstrate this with the Chord plot type.
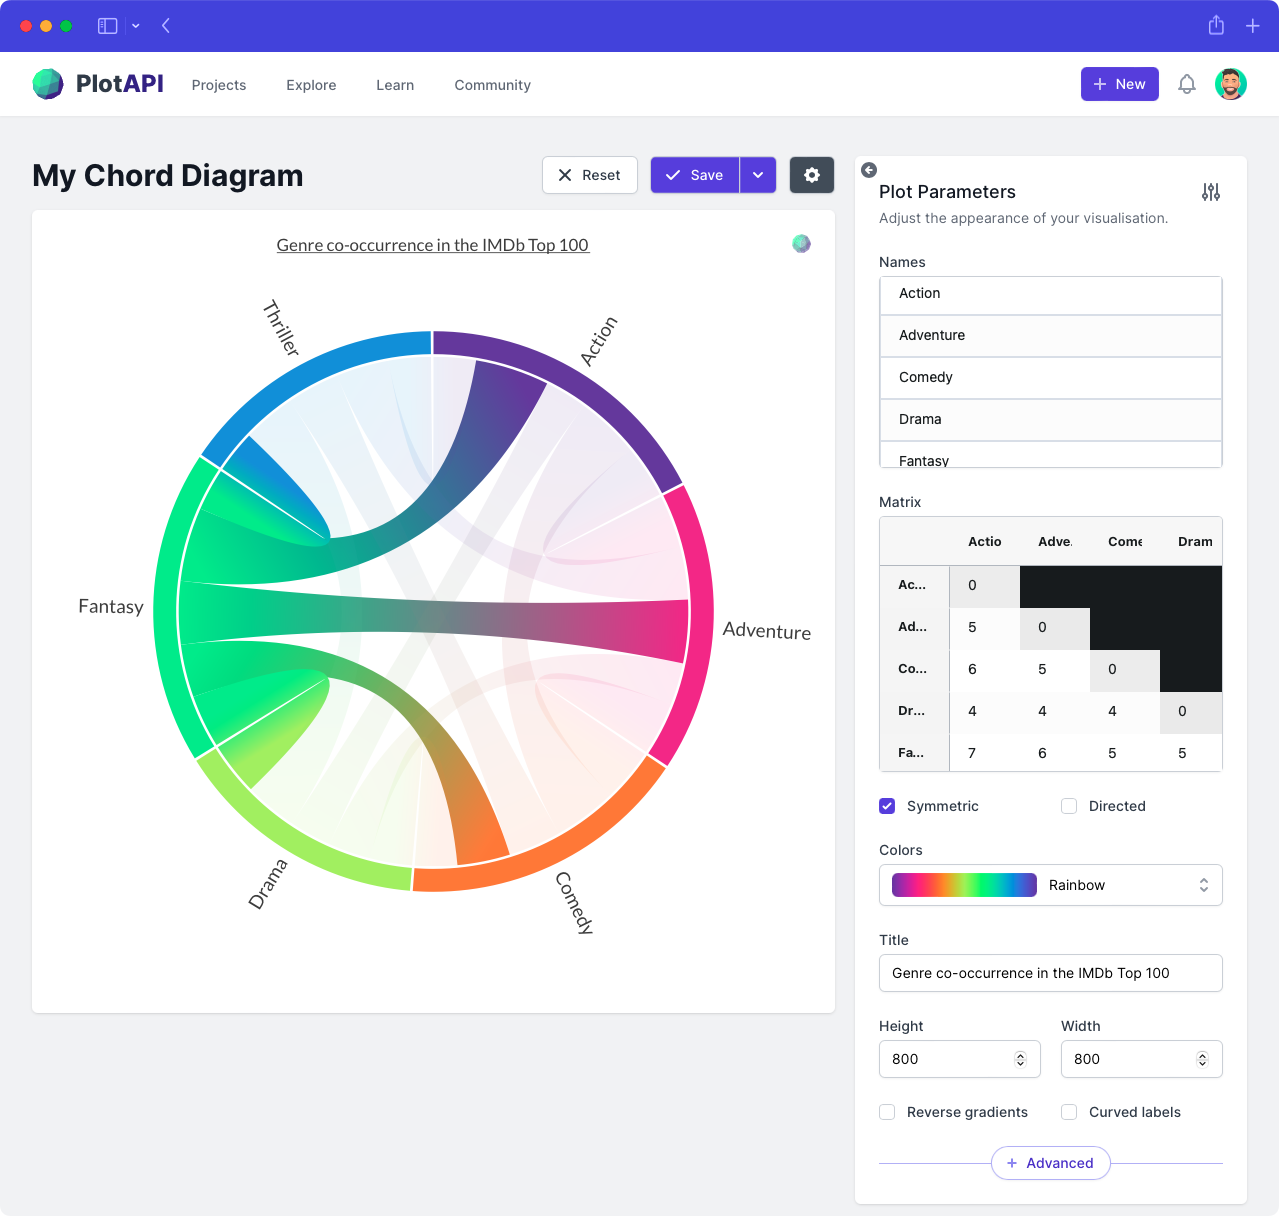
You can even adjust the appearance of your visualization directly from the App!