Beautiful, interactive, and customizable
Easily turn your data into engaging visualizations with PlotAPI's friendly interface — with or without code.
-
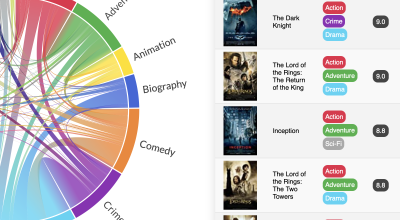
Chord
Illustrate inter-relationships between data.
-
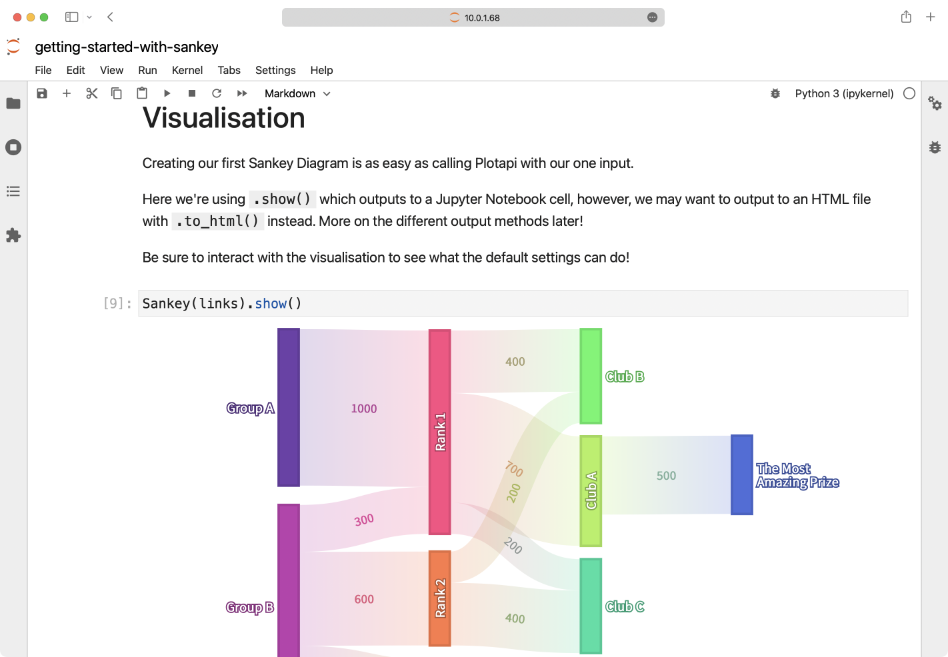
Sankey
Illustrate the flow from one set of values to another.
-
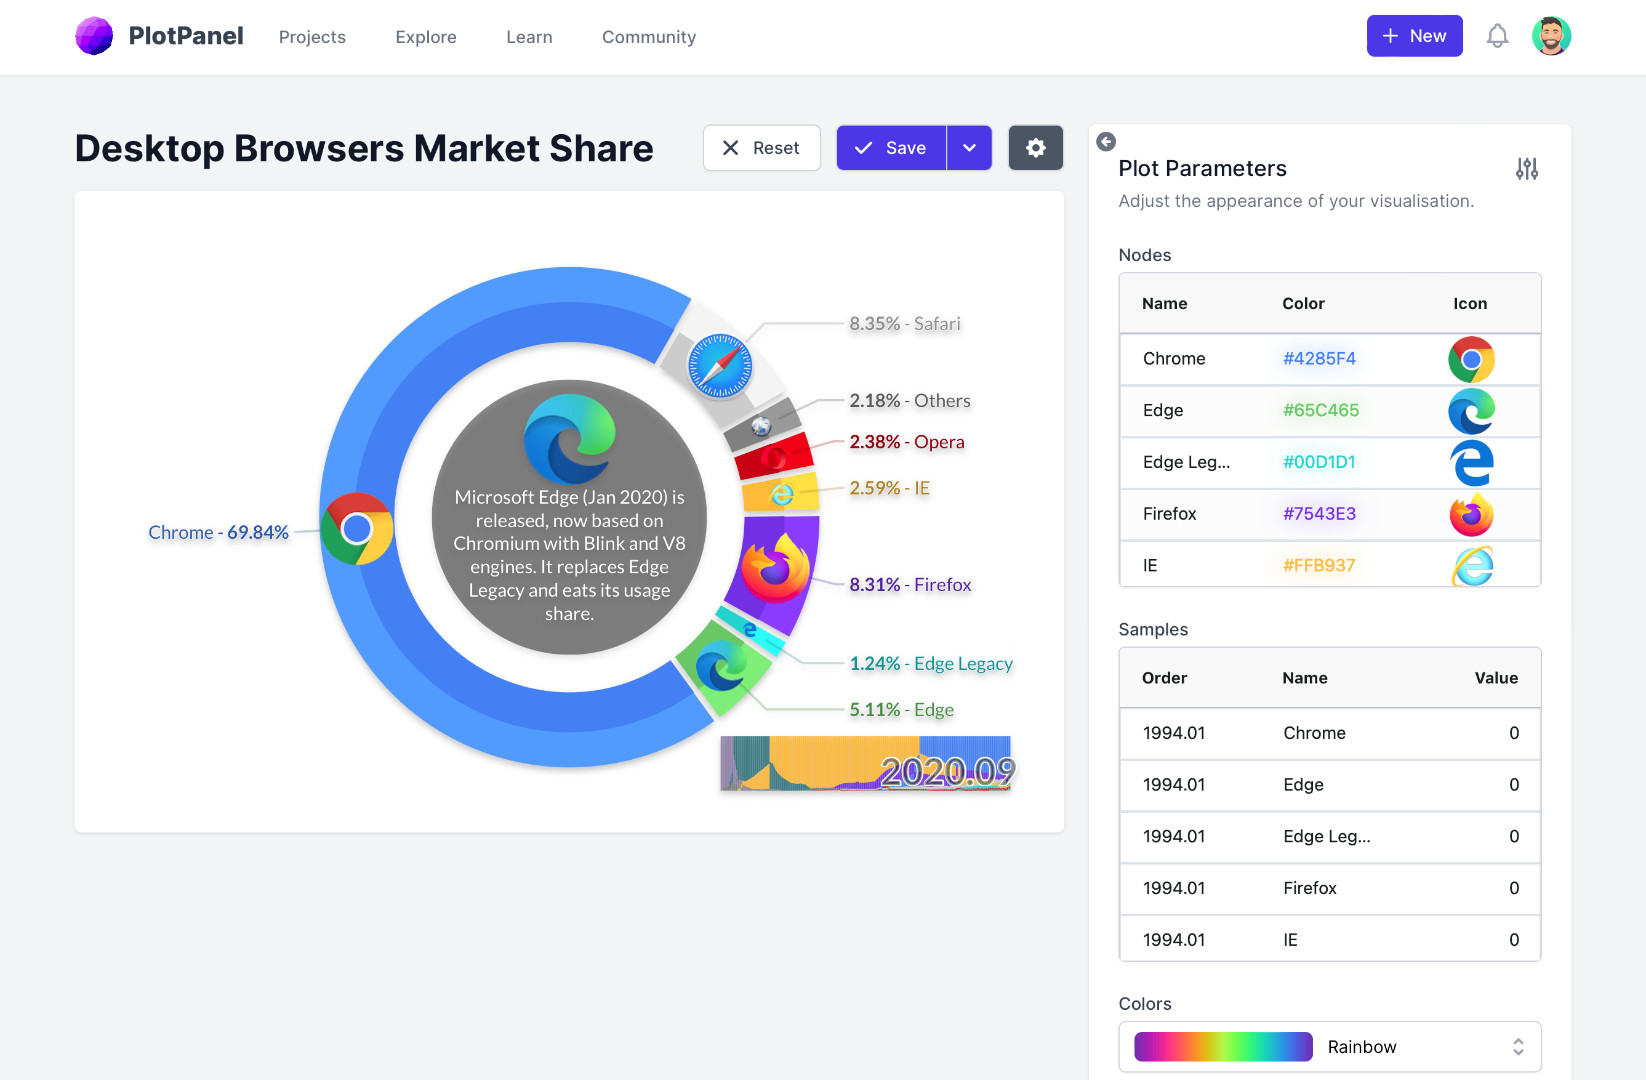
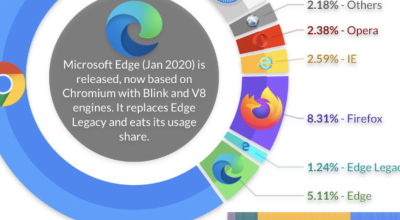
Pie Fight
A beautiful take on the classic Pie Chart Race
-
Bar Fight
A beautiful take on the classic Bar Chart Race!
-
Line Fight
A beautiful take on the classic Line Chart Race!
-
Terminus
Illustrate sharing something out amongst recipients.
-
Heat Map
A beautiful and interactive take on Heat Maps.
-
Pareto Front
Illustrate non-dominated (Pareto) fronts over time.
-
Split Chord
Illustrate inter-relationships between bipartite data.
-
Goal Rush
Illustrate progress toward a goal over time.
Powerful API for coders
Generate visualisations through the API from Python, Rust, and more. Super-charge your notebooks with inline visualisations!
Python package
pip install plotapi
Rust crate
plotapi = "0.1.1"
For everything else, there's the REST API.
“Whether it's Jupyter Lab, Jupyter Notebook, Google Colab, Python scripts, or others through HTTP - we've got you covered!”
Powerful App for everyone
Easily turn your data into engaging visualizations with the app's friendly interface — no coding required.
Create and manage projects, work on them privately, in teams, or share them with the world.
Get Access
Save 60% with the Version 8 Launch Offer
PlotAPI Pro
Save £24
Offer applied!
Save £352
4 months free!
A personal license for PlotAPI, enabling beautiful and interactive visualizations with or without a single line of code.
PlotAPI Business
Save £616
4 months free!
Save £42
Offer applied!
A business license for PlotAPI, enabling beautiful and interactive visualizations with or without a single line of code.
Offer
Showcase
Check out a few hand-selected visualisations below, or visit the showcase gallery to see more.
Someone just purchased
PlotAPI Pro
with the offer Today!
Multiple formats Save locally, or upload!
Enabling beautiful interactive visualizations with any language, including Python notebooks.
Export to PNG, PDF, SVG, MP4, and HTML.
Upload, embed, and share privately or publicly.
