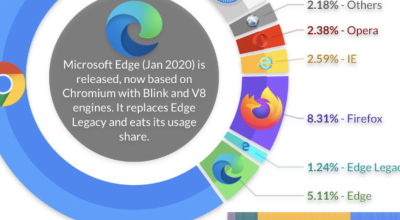
Desktop Browsers Market Share
Plot Details
Details shared by the author of this PieFight visualisation.
- Title
- Desktop Browsers Market Share
- Description
- In this project we're going to use PlotAPI to visualize desktop browser market share over time. We're going to use data that has been published by multiple sources for different periods, as there is no single data source that covers everything. Browsers that did not have significant market share have been grouped and labelled as "Others".