Visualizations Chord
Asymmetric relationships
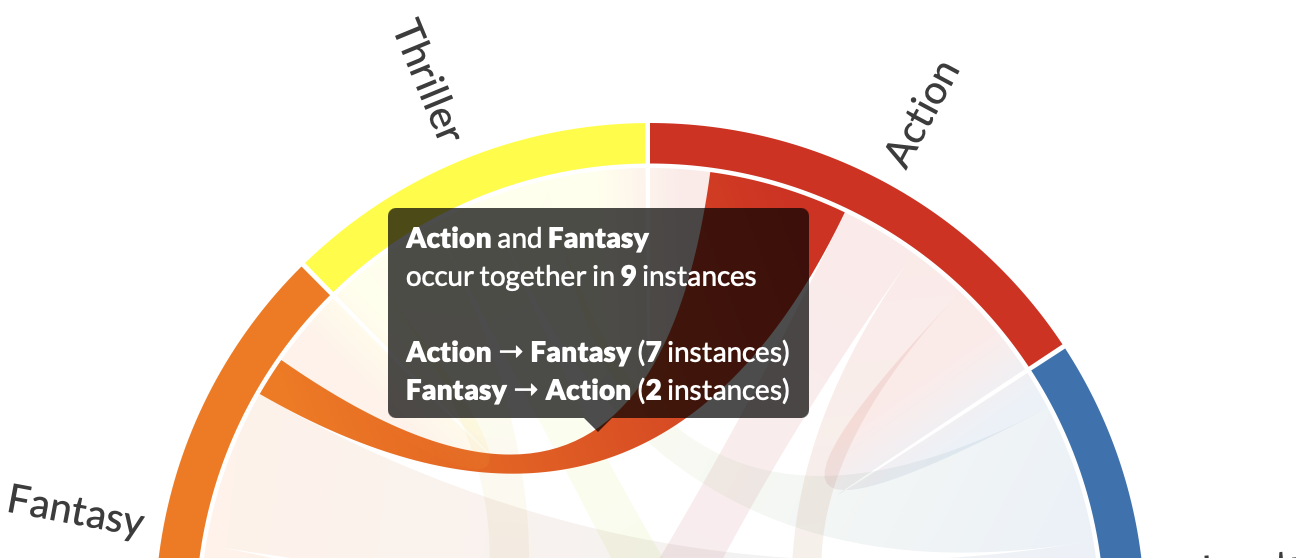
By turning symmetric mode off, each end of a chord can be of different size, and it also changes the information presented in the popup.
Sample data
Let's import PlotAPI and load our sample data.
from plotapi import Chord

matrix = [
    [0, 1, 1, 1, 1, 1],
    [2, 0, 6, 5, 2, 7],
    [6, 3, 0, 4, 5, 7],
    [9, 3, 4, 0, 4, 7],
    [2, 8, 6, 7, 0, 9],
    [5, 3, 3, 4, 2, 0],
]

names = ["Action", "Adventure", "Comedy", "Drama", "Fantasy", "Thriller"]
Demonstration
To enable asymmetric mode, we set the symmetric parameter to False.
Chord(matrix, names, colors="green_blue", symmetric=False).show()
Interact with the chords to see the enhanced details.


