Plotapi, beautiful by default.
Let plotapi do the heavy lifting – enabling beautiful interactive visualisations with a single line of code (instead of hundreds).
Get PlotapiPokemon Types with Plotapi Heat Map
Preamble
from plotapi import HeatMap
import json
HeatMap.set_license("your username", "your license key")
Introduction
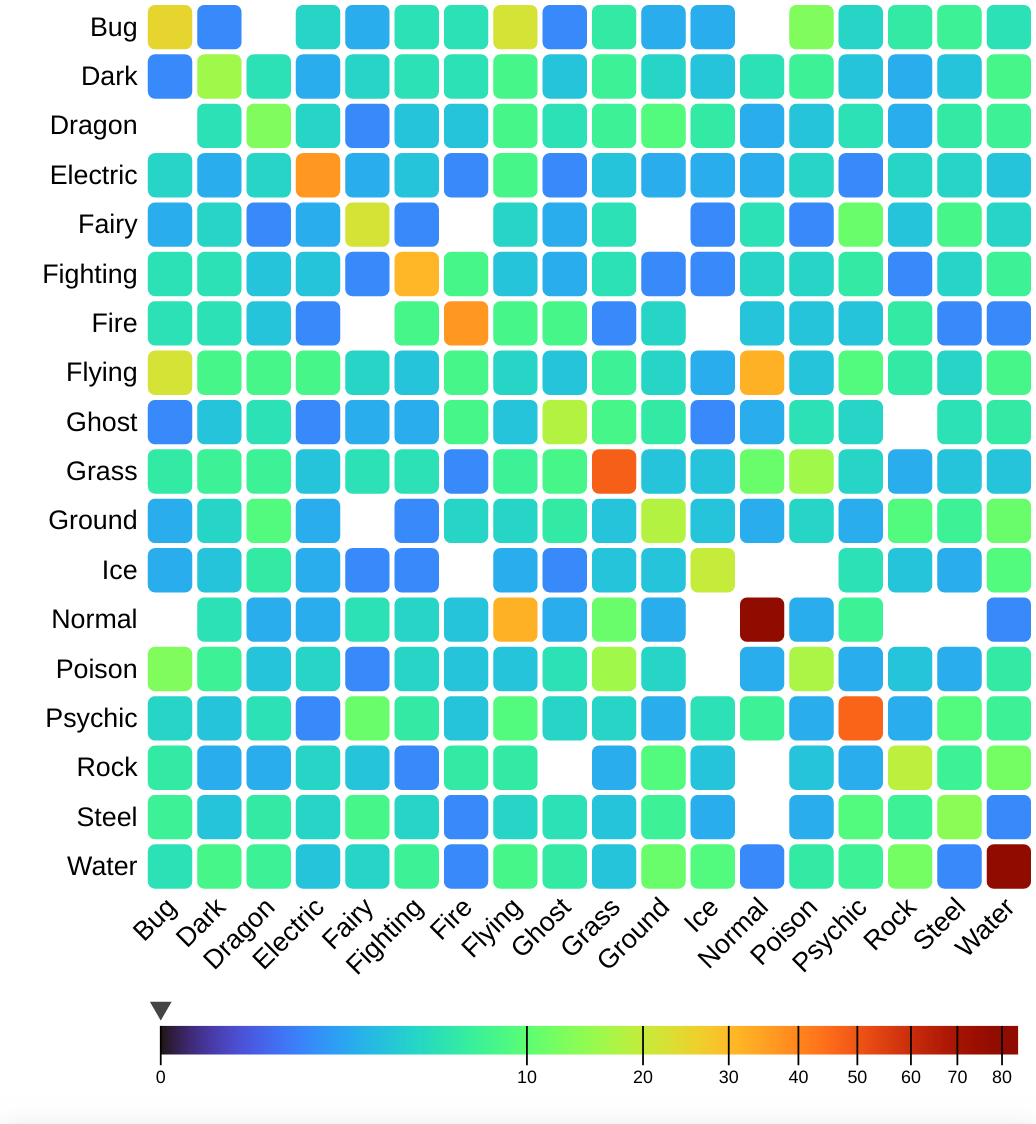
In this notebook we're going to use Plotapi Heat Map to visualise the co-occurrences between Pokémon types. We"ll use Python, but Plotapi can be used from any programming language.
Dataset
We're going to use Pokémon (Gen 1-8) data, a fork of which is available in this repository. Let"s get loading the data.
with open("pokemon_types.json", "r") as f:
data = json.load(f)
names = ["Bug", "Dark", "Dragon", "Electric", "Fairy", "Fighting",
"Fire", "Flying", "Ghost", "Grass", "Ground", "Ice",
"Normal", "Poison", "Psychic", "Rock", "Steel", "Water"]
Visualisation
Let's use Plotapi Heat Map for this visualisation, you can see more examples in the Gallery.
We're going to adjust some layout and template parameters, and flip the intro animation on too.
Because we're using a data-table, we can also click on any part of the diagram to "lock" the selection.
HeatMap(
data["matrix"],
col_names=names,
row_names=names,
details_thumbs=data["details_thumbs"],
noun="Pokemon",
thumbs_width=50,
thumbs_margin=1,
popup_width=600,
data_table_column_width=100,
data_table=data["data_table"],
data_table_show_indices=False,
zero_color="transparent",
scale="exponential",
scale_exponent=0.40,
colors="turbo"
).show()
Made with Plotapi
You can create beautiful, interactive, and engaging visualisations like this one in any programming language with Plotapi.
Get the Books
Enjoying these notebooks and want more on the subject? Check out the practical books on Data Science, Visualisation, and Evolutionary Algorithms.
Get the books